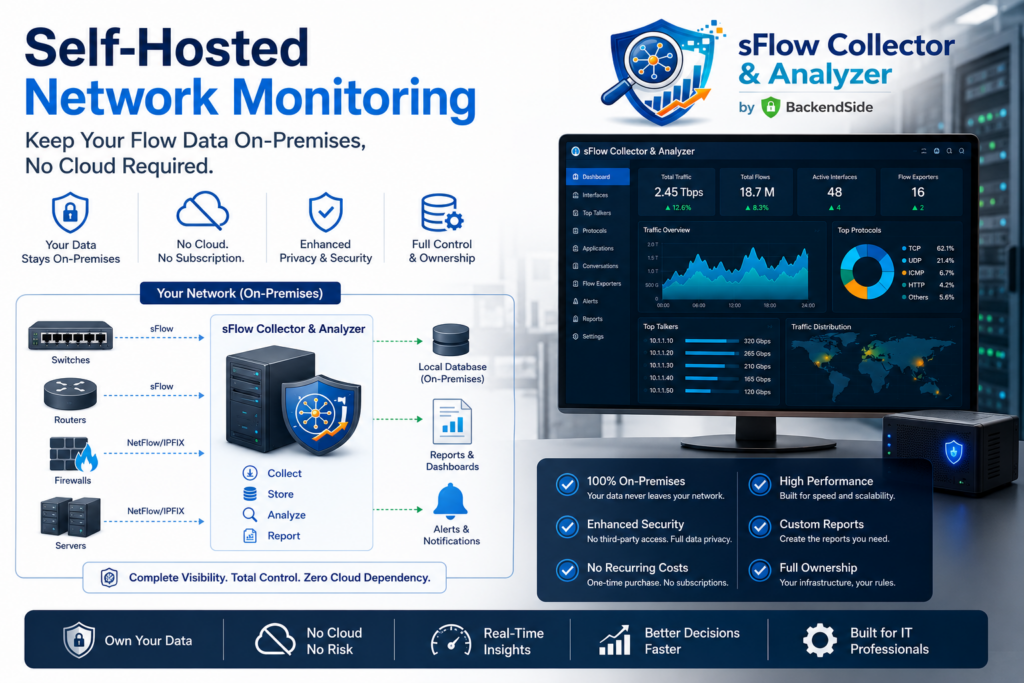
Your network traffic is a map of everything your organization does—who talks to whom, when, and how much. So it’s worth asking a blunt question about your monitoring stack: where does all that data actually go? With most modern SaaS tools, the answer is “someone else’s cloud.” Self-hosted network monitoring flips that around: the telemetry never leaves your walls. Here’s why that matters, and how you can run a complete sFlow collector and analyzer on a single machine.
The hidden cost of cloud-based monitoring
Cloud monitoring is convenient, but it comes with trade-offs that quietly add up:
- Your traffic metadata leaves the building. Even “just metadata” reveals internal topology, application usage, and communication patterns.
- Recurring, usage-scaled billing. Costs climb with flow volume, device count, and retention—exactly as your network grows.
- Compliance friction. Regulated environments often can’t ship network data to third-party clouds without a mountain of paperwork.
- Dependency on someone else’s uptime. If the SaaS is down or you’re offline, you’re blind.
What you get when you self-host
Running monitoring on your own hardware isn’t a compromise—for many teams it’s the better architecture:
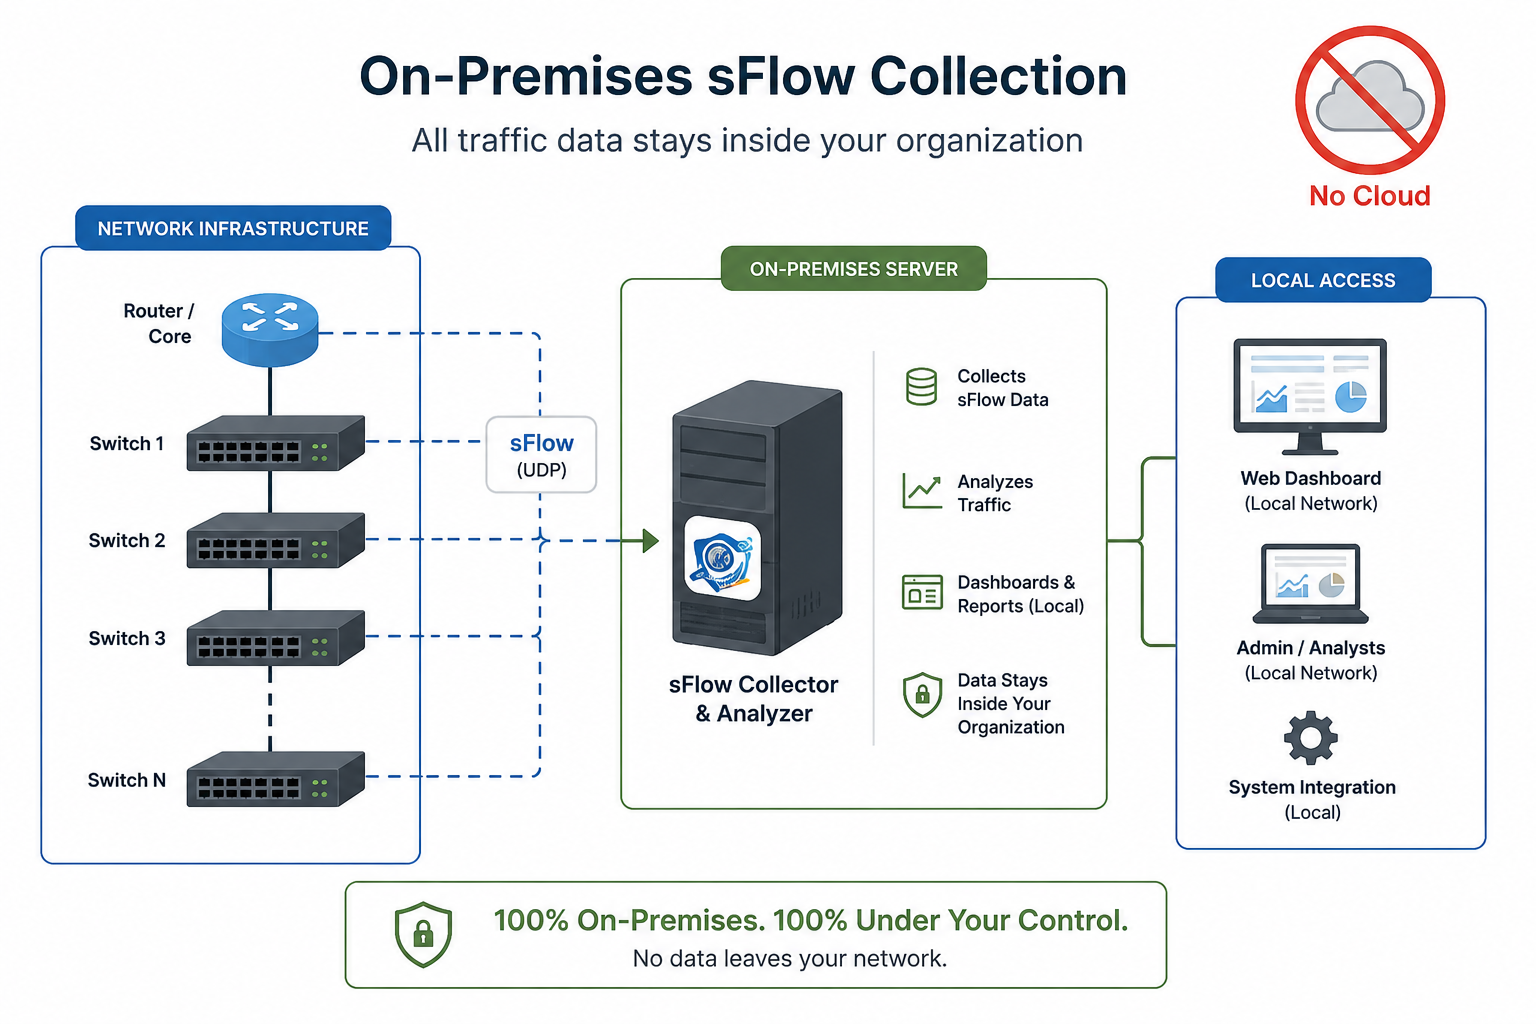
- Data sovereignty. Flow data is captured, stored, and analyzed entirely on-premises. Nothing is uploaded, indexed, or retained by a vendor.
- Predictable cost. No per-flow metering, no surprise overage. One machine, one app.
- Works air-gapped. Perfect for isolated, secure, or industrial networks that can’t reach the internet at all.
- Full control. Your retention policy, your ports, your certificates, your rules.
Self-hosting doesn’t have to mean self-suffering
The usual objection to self-hosting is operational overhead—standing up databases, message queues, and a dashboard stack, then babysitting all of it. It doesn’t have to be that way. BackendSide sFlow Collector & Analyzer packs the entire pipeline into a single Windows application: the sFlow collector, the analytics engine, the alerting, and an HTTPS web dashboard all run in one process. Install it, point your switches at it, and you have a working monitoring platform—no separate database server, no cloud account, no moving parts to wire together.
What it does with your traffic
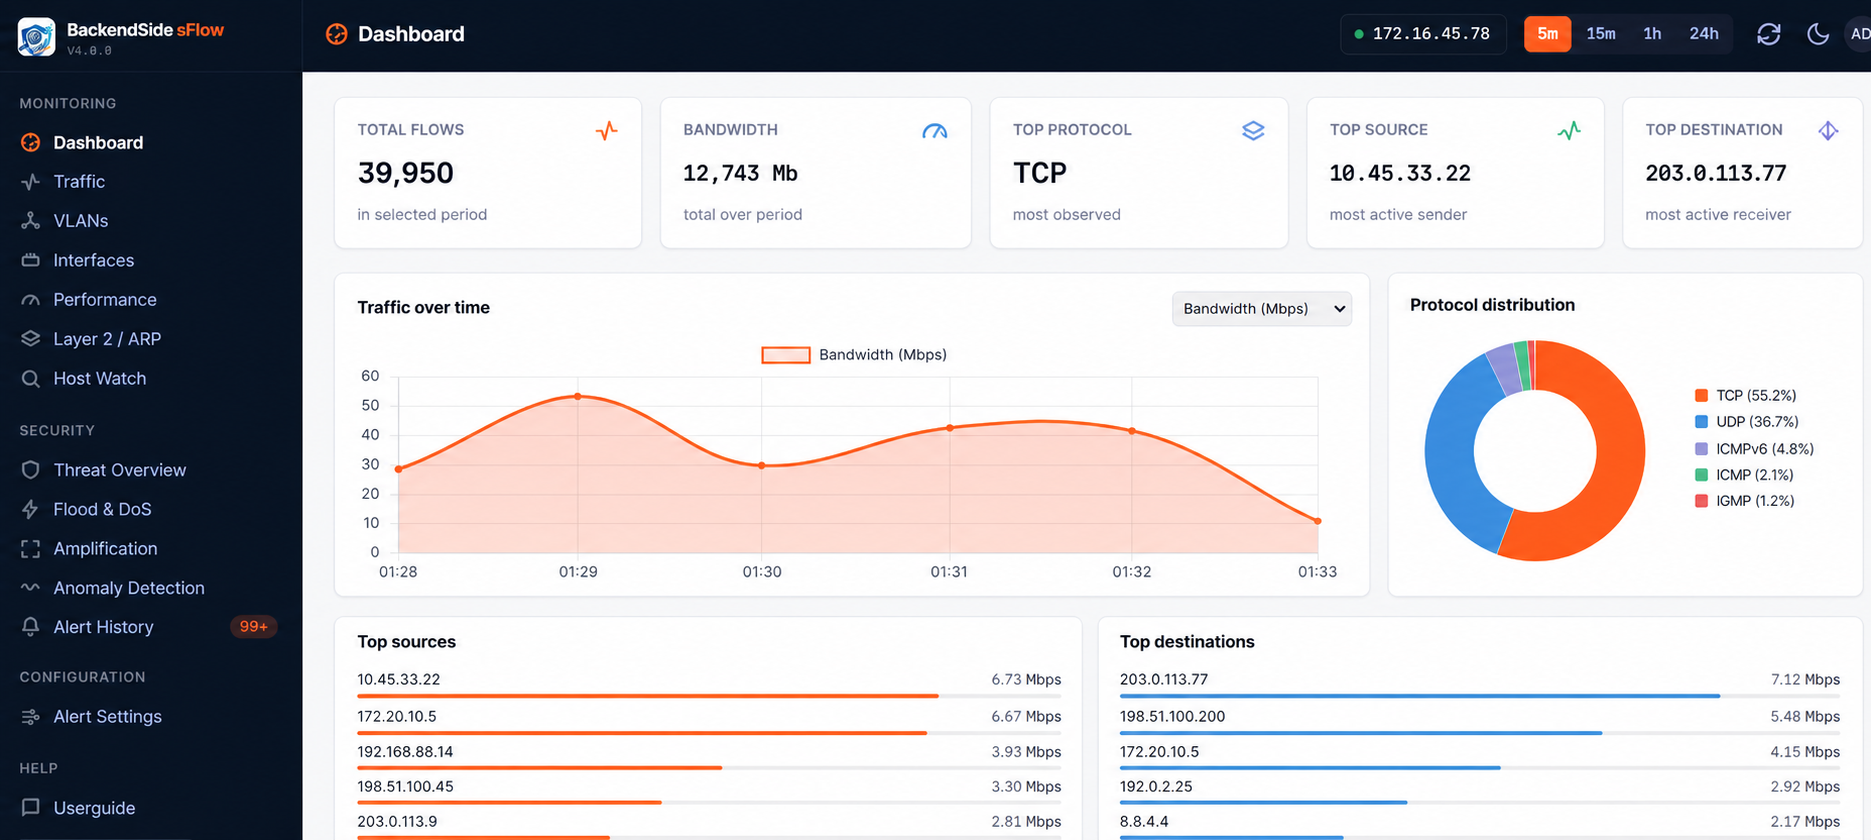
Once it’s ingesting sFlow, you get a real-time dashboard of bandwidth, top talkers, protocols, VLANs, and interfaces—plus built-in detection for floods, scans, amplification attacks, and Layer-2 threats, and adaptive baselines that learn your network’s normal behavior. All of it computed and stored locally, served over an HTTPS dashboard with sign-in, on hardware you control.
BackendSide sFlow Collector & Analyzer — A Complete Self-Hosted Monitoring Stack in One App
BackendSide sFlow Collector & Analyzer packs the entire pipeline into a single Windows application — the sFlow v5 collector, the analytics engine, alerting, and an HTTPS web dashboard all run in one process. Install it, point your switches at it, and every byte is captured, analyzed, and stored on hardware you control. No cloud account, no per-flow metering, no database server to babysit.
The bottom line
If your network telemetry is sensitive—and it is—the most secure place for it is your own infrastructure. Self-hosted network monitoring gives you privacy, predictable cost, and total control, and with the right tool it’s no harder to run than any other desktop app. Keep your data where it belongs.
Leave a Reply