
NetPulse – Real-Time Network Monitor for Windows
See exactly what your machine's network is doing — live download and upload speeds, TCP/UDP/IP/ICMP protocol charts, per-adapter throughput, every connection mapped to the process that owns it, ping / DNS / traceroute probes, saved history, how much data you’ve used today and this month, and threshold alerts by email, webhook or Pushover. Works the same on a desktop PC and on Windows Server over Remote Desktop.
Download Desktop Version 2.2.0
Free on the Microsoft Store — no subscription, no ads.

New in 2.2 — data usage and smarter alerts
NetPulse now tracks how much data you use — today and this month, per adapter or in total — with a billing day setting so “this month” matches your plan, and an alert before you hit a cap. History can chart a single adapter and reach back up to 365 days. Alerts now trigger once, remind you while the problem holds, and tell you when it clears, with new rules for a dropped link, ping latency and loss. And Start with Windows now works in the Microsoft Store version.
Changelog — what's new in each release
Full release history from the original v1.0 through the 2.0 redesign to 2.2.0 — data-usage tracking, per-adapter history, alerts that remind and clear, and a long list of fixes.
View the full changelogUser Guide — every section explained
A plain-English walkthrough of Dashboard, Protocols, Interfaces, Connections, Probes, History, Alerts and Settings — plus data usage and billing days, alert reminders, email / webhook / Pushover delivery and the system tray.
Read the User GuideFeatures
📊 Dashboard Overview
Live summary cards for current download and upload speed, active TCP connections, total connections, the busiest adapter, and data used today and this month — with a rolling total-throughput chart and the latest alert status, all on one screen.
📈 Protocol Charts
Four live charts for TCP, UDP, IP and ICMP — connections, packets per second, errors and echo counts. Flip the IPv4 / IPv6 toggle to switch the TCP/UDP/IP charts; each keeps the last 60 seconds on screen.
🧩 Per-Adapter Interfaces
A sortable table of your network adapters with live in / out / total Kbps, a utilization bar, link speed, IP address, MAC address, MTU and error counts — each row with its own trend sparkline. An In totals switch keeps virtual adapters (Hyper-V, WSL, VPN) from double-counting your traffic.
🔗 Connections by Process
Every active TCP/UDP connection (IPv4 + IPv6) in real time, mapped to the process that owns it — with PID, protocol, local and remote address and state. Filter by text, hide listeners, export to CSV, and right-click a row to resolve its host name, copy it, filter by its process or end that process.
📡 Probes — Ping, DNS, Traceroute
Test connection quality to any host: continuous ping with current / average / min / max latency, jitter and packet-loss on a live chart, plus DNS resolution timing and a stoppable traceroute with per-hop round-trip times and host names.
🕘 History & Trends
NetPulse saves network activity locally so you can look back from the last 15 minutes up to a year — for all adapters or a single one. You choose how long history is kept (1–365 days), and export any range to CSV or PNG.
📶 Data Usage & Billing Day
See how much you’ve downloaded and uploaded today, this month and day by day for the last 31 days, per adapter or in total. Set your plan’s billing day so “this month” matches your bill, and get an alert before you reach a data cap.
🔔 Threshold Alerts
Rules on throughput (machine-wide or per adapter), connections, errors, link up/down, ping latency and loss, and data used. A rule can wait until a condition has held for a few seconds, notifies once, reminds you while it keeps holding, and sends a Resolved message when it clears — no spam.
✉️ Multi-Channel Delivery
Get alerts where you'll see them: desktop notifications, email (with selectable SMTP / SMTPS / STARTTLS / custom port), webhook in Slack, Discord or generic JSON format, and Pushover. A Test action confirms delivery before you rely on it, and failed deliveries show up in the alerts feed.
🖥️ Runs Quietly in the Tray
Minimize or close to the system tray and NetPulse keeps monitoring — double-click to restore, right-click for Open / About / Exit. Turn on Start with Windows and start minimised to leave it running all the time.
🌓 Modern Light / Dark UI
A clean interface that follows the Windows theme, and runs the same on a desktop PC or on Windows Server over Remote Desktop. It only ever monitors the machine it's running on — everything stays local.
Screenshots
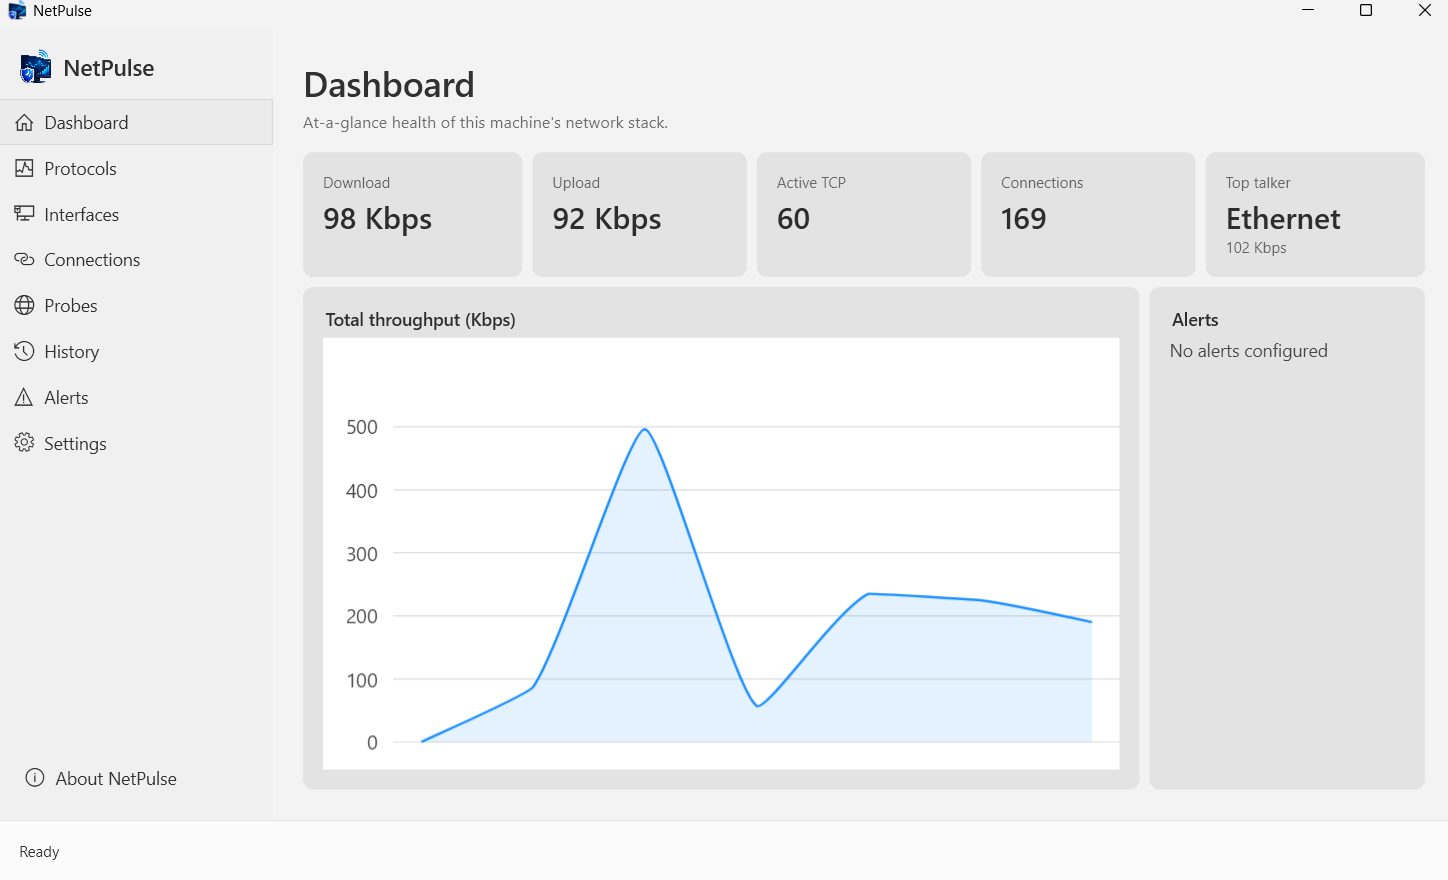
Dashboard & live throughput
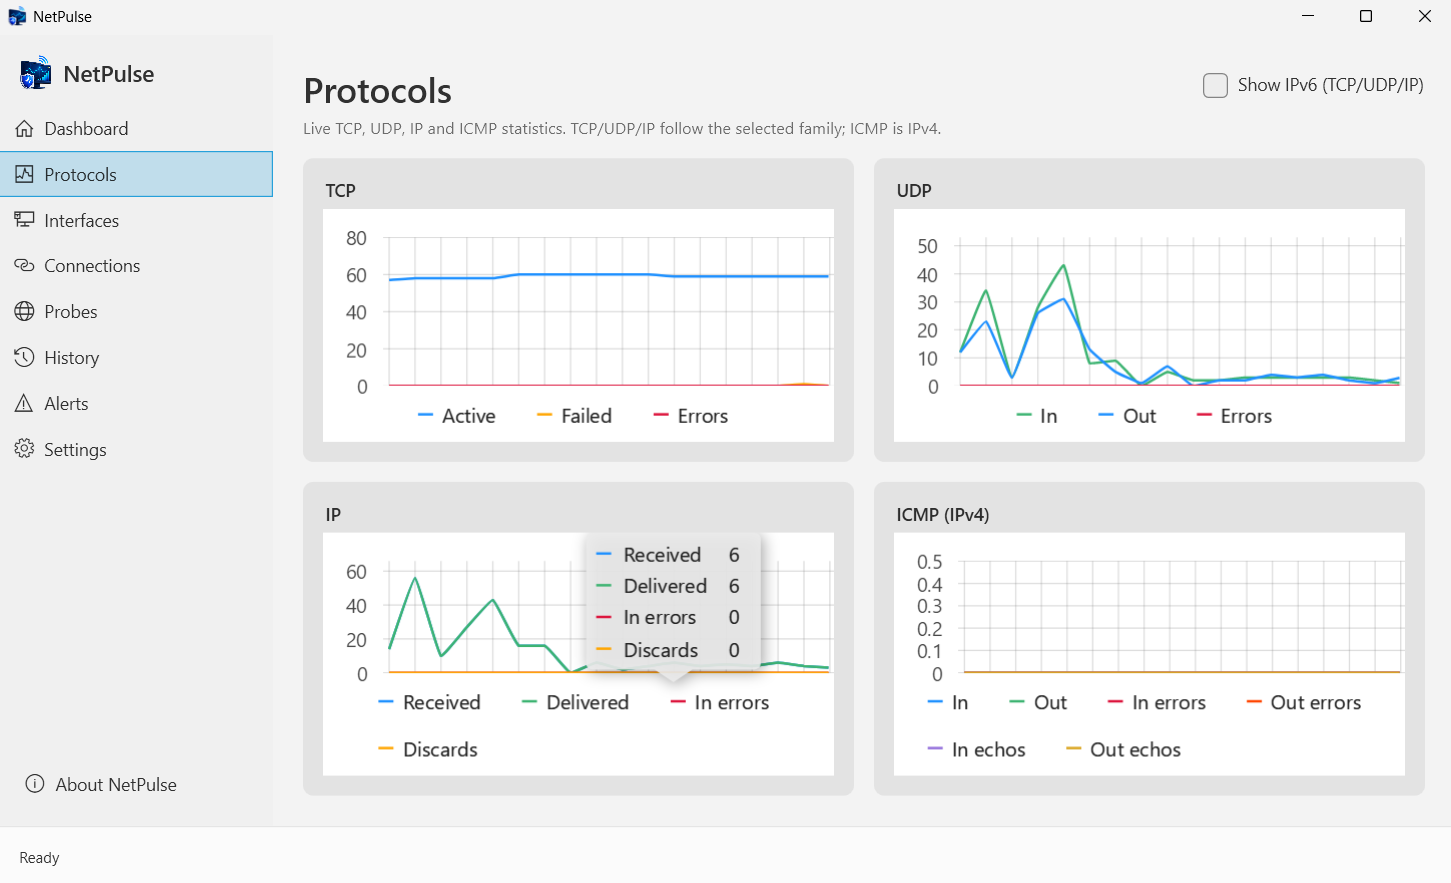
Protocol charts (IPv4 / IPv6)
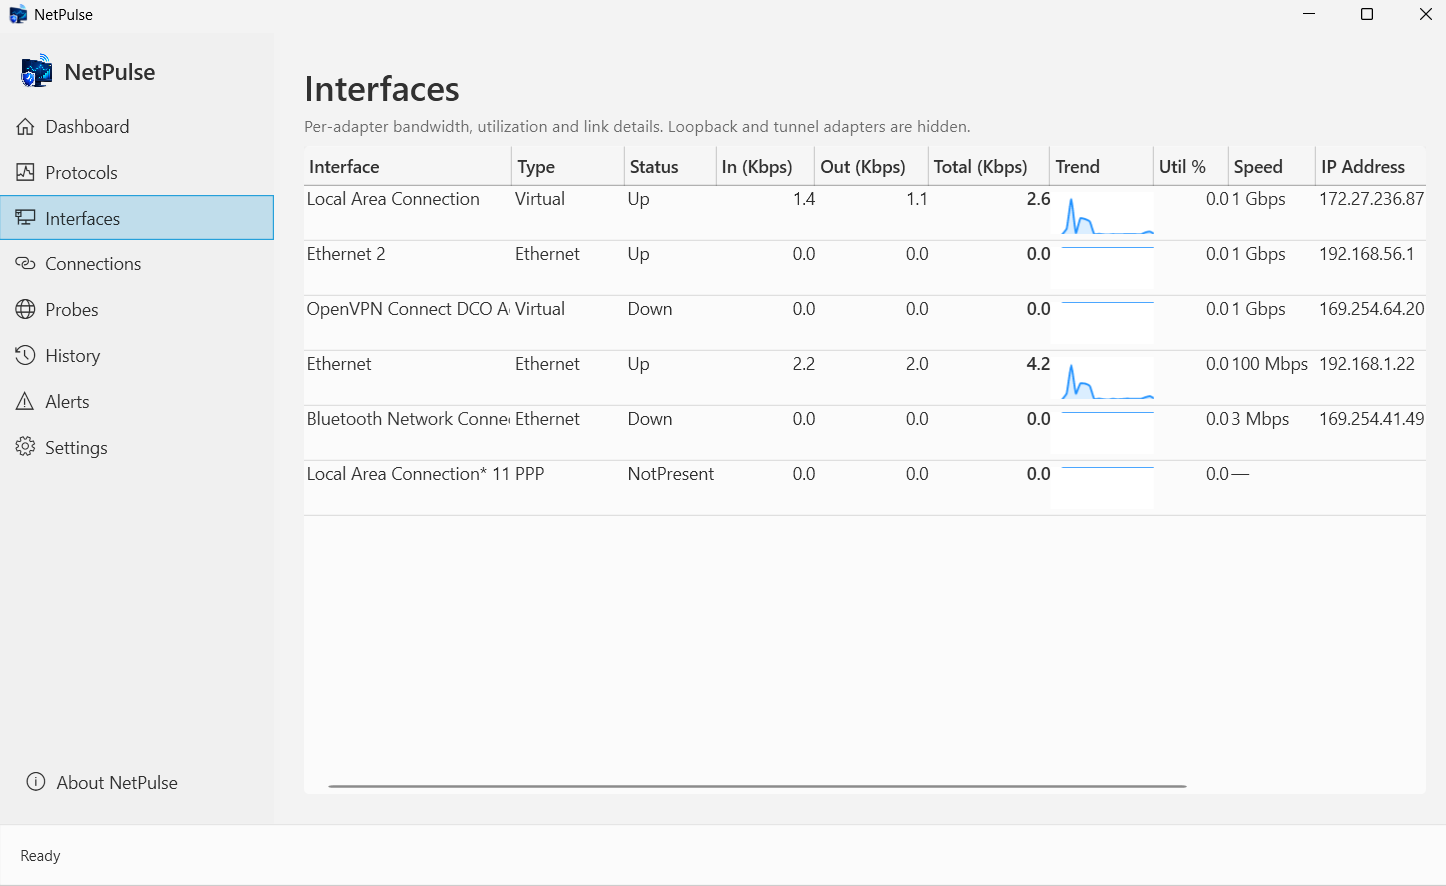
Interfaces — per-adapter bandwidth
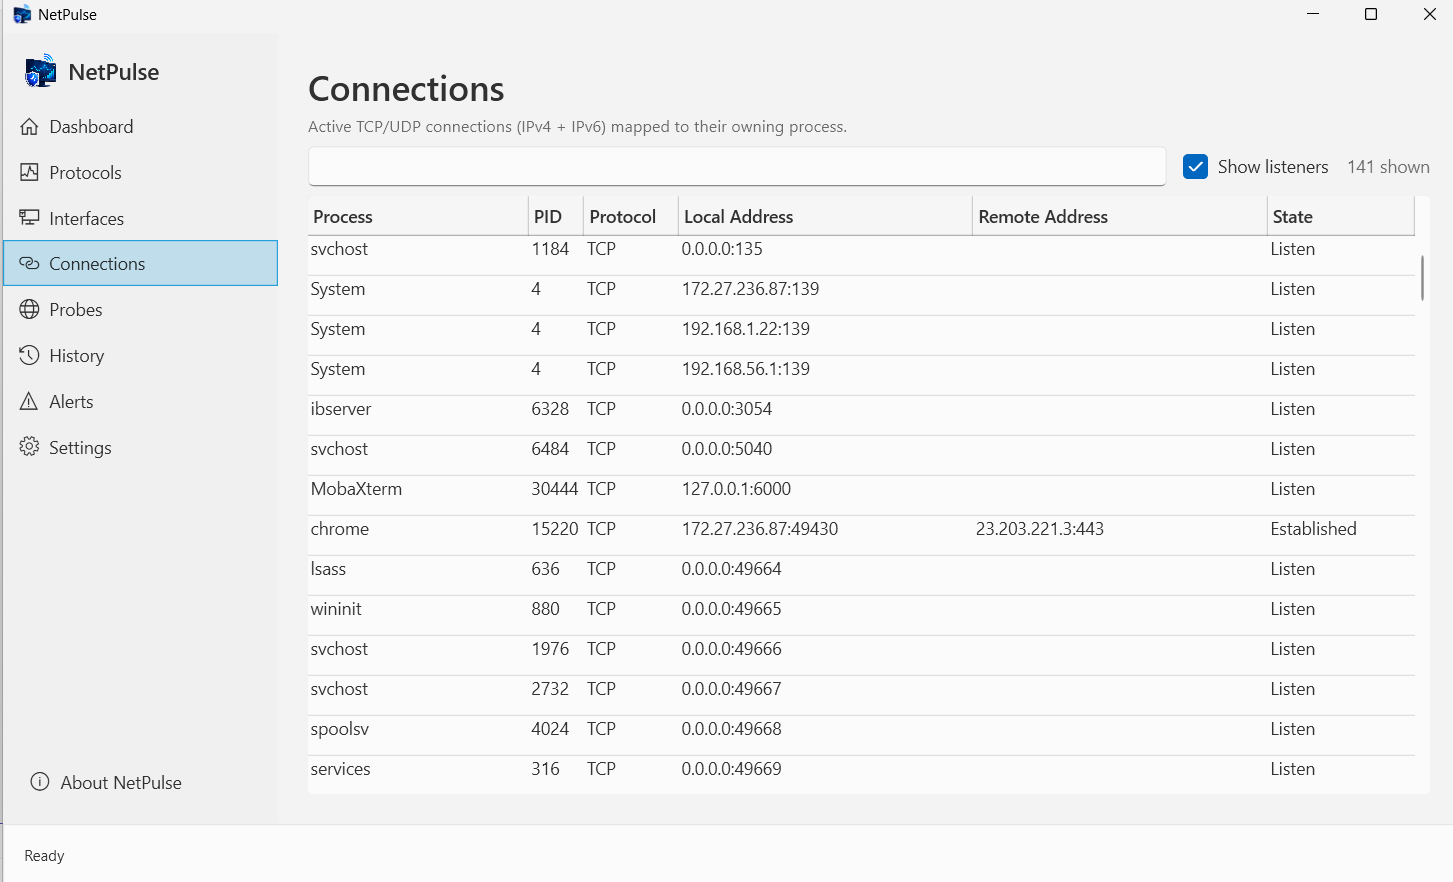
Connections by process
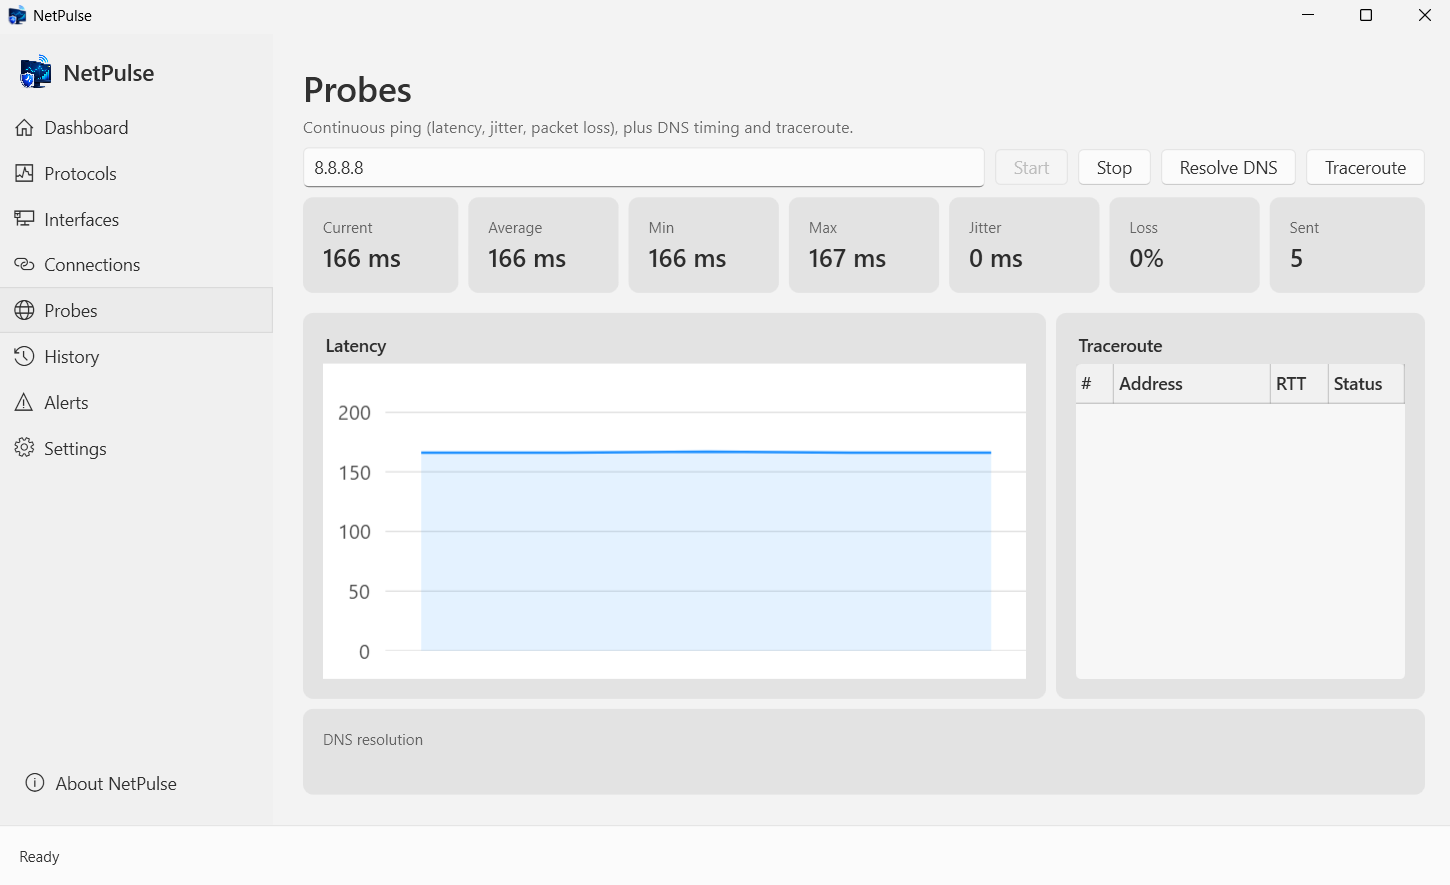
Probes — ping, DNS, traceroute
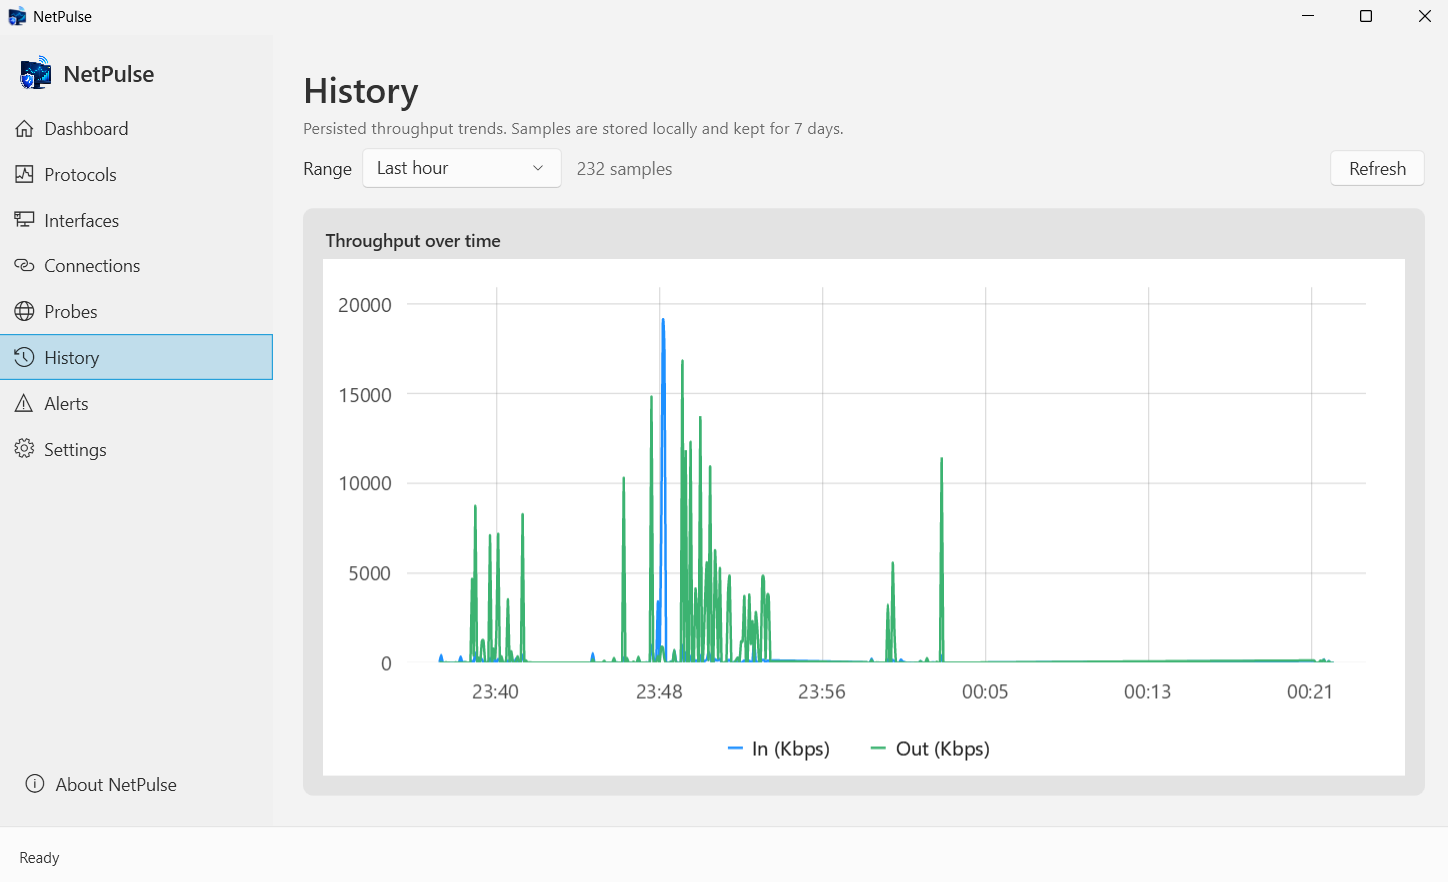
History — saved trends
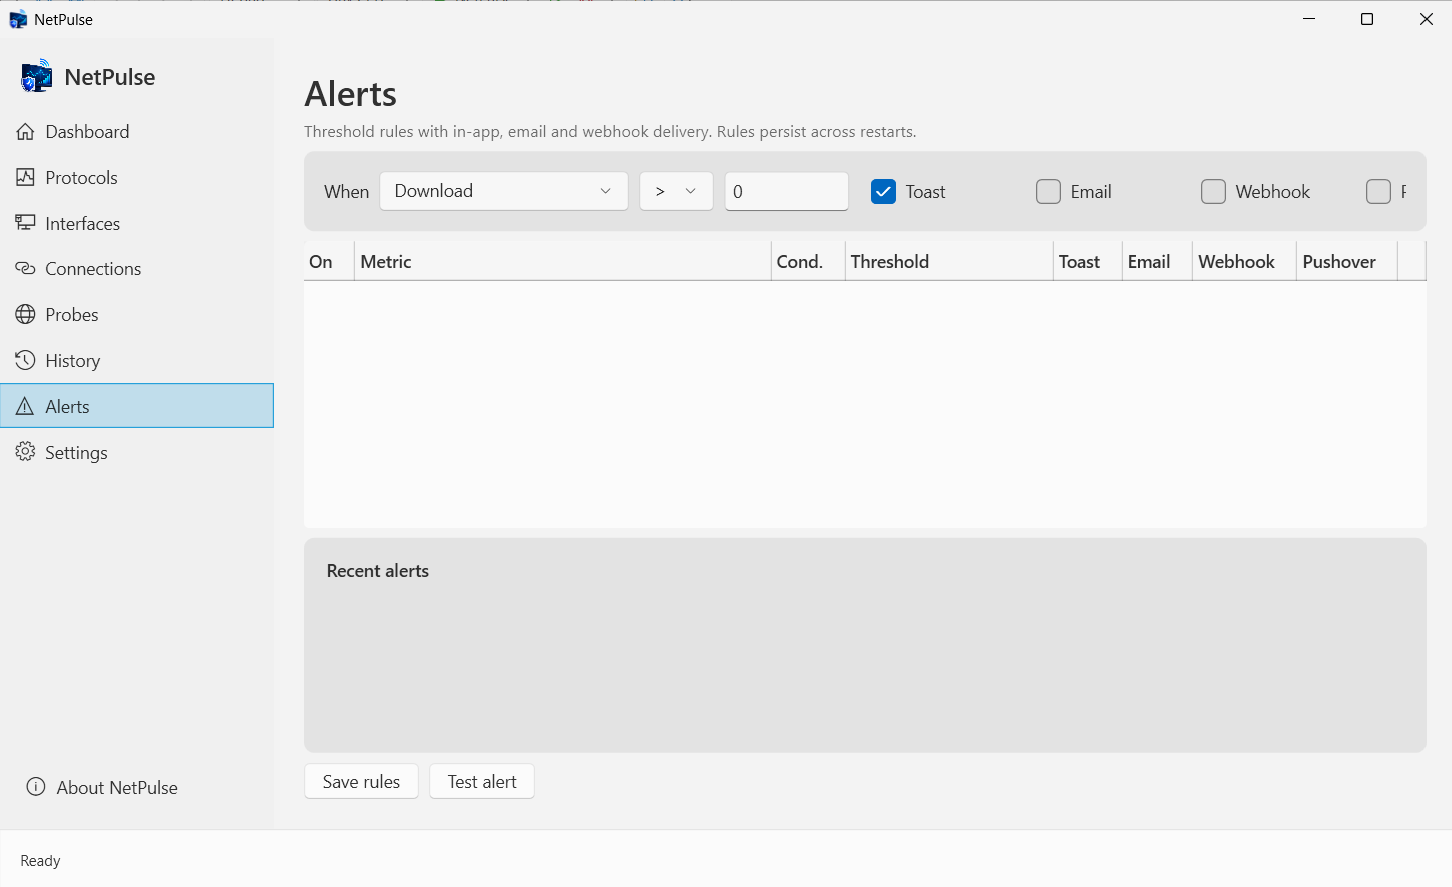
Alerts — threshold rules
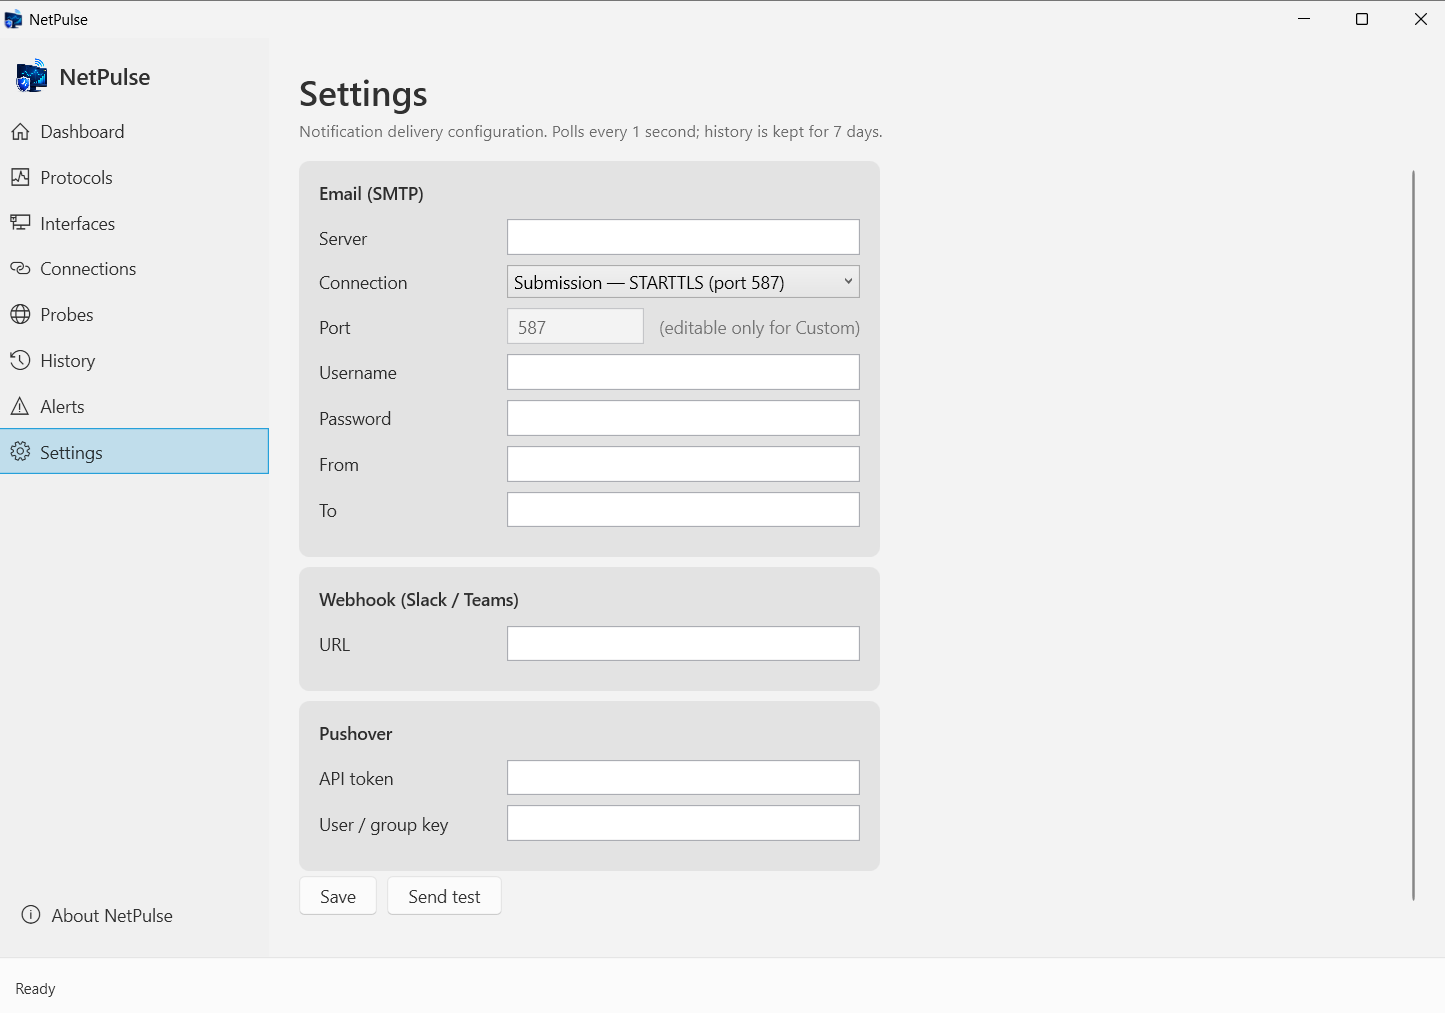
Settings — email / webhook / Pushover
Latest Release
Version 2.2.0 — October 15, 2026
Data-usage tracking — today, this month and the last 31 days, per adapter or in total — with a billing-day setting and alerts before you hit a cap. Per-adapter history and ranges up to 365 days. Alerts that trigger once, remind you while the condition holds and tell you when it clears, plus new rules for a dropped link and ping latency or loss. Start with Windows now works in the Microsoft Store version, traceroute can be stopped, IPv6 is counted in the TCP and UDP totals, and virtual adapters no longer double-count your traffic.