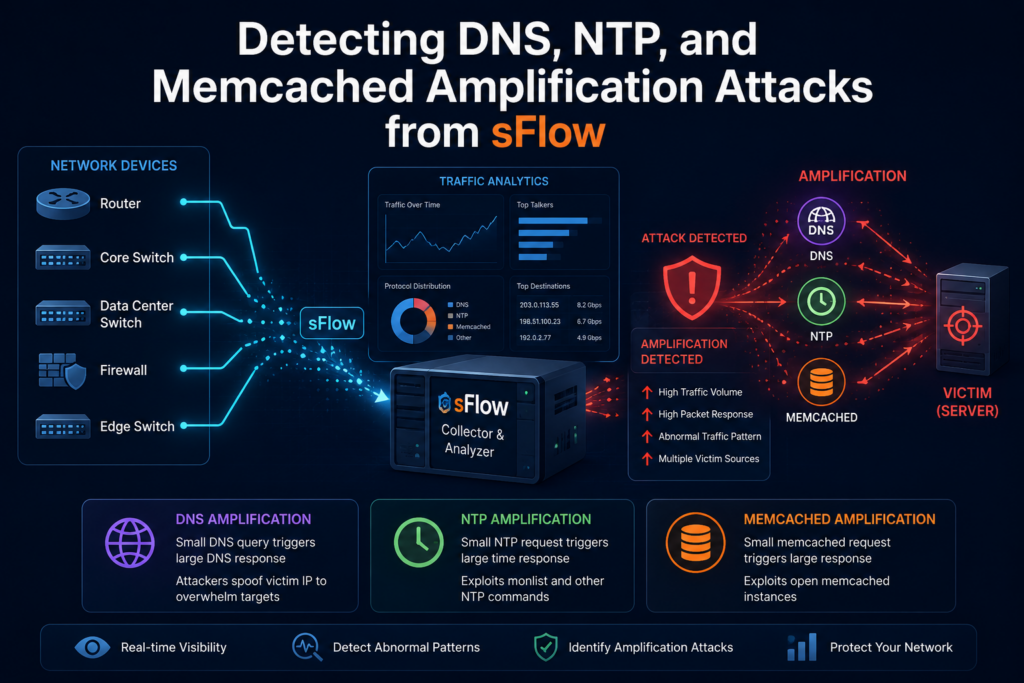
Amplification attacks are the reason a handful of spoofed packets can knock a target offline with hundreds of gigabits of traffic. They’re cheap to launch, brutally effective, and they abuse services you probably run yourself. The good news: they leave an unmistakable fingerprint in your flow data. Here’s how DNS, NTP, memcached, and other amplification attacks work—and how to spot them the moment they start using sFlow.
How amplification actually works
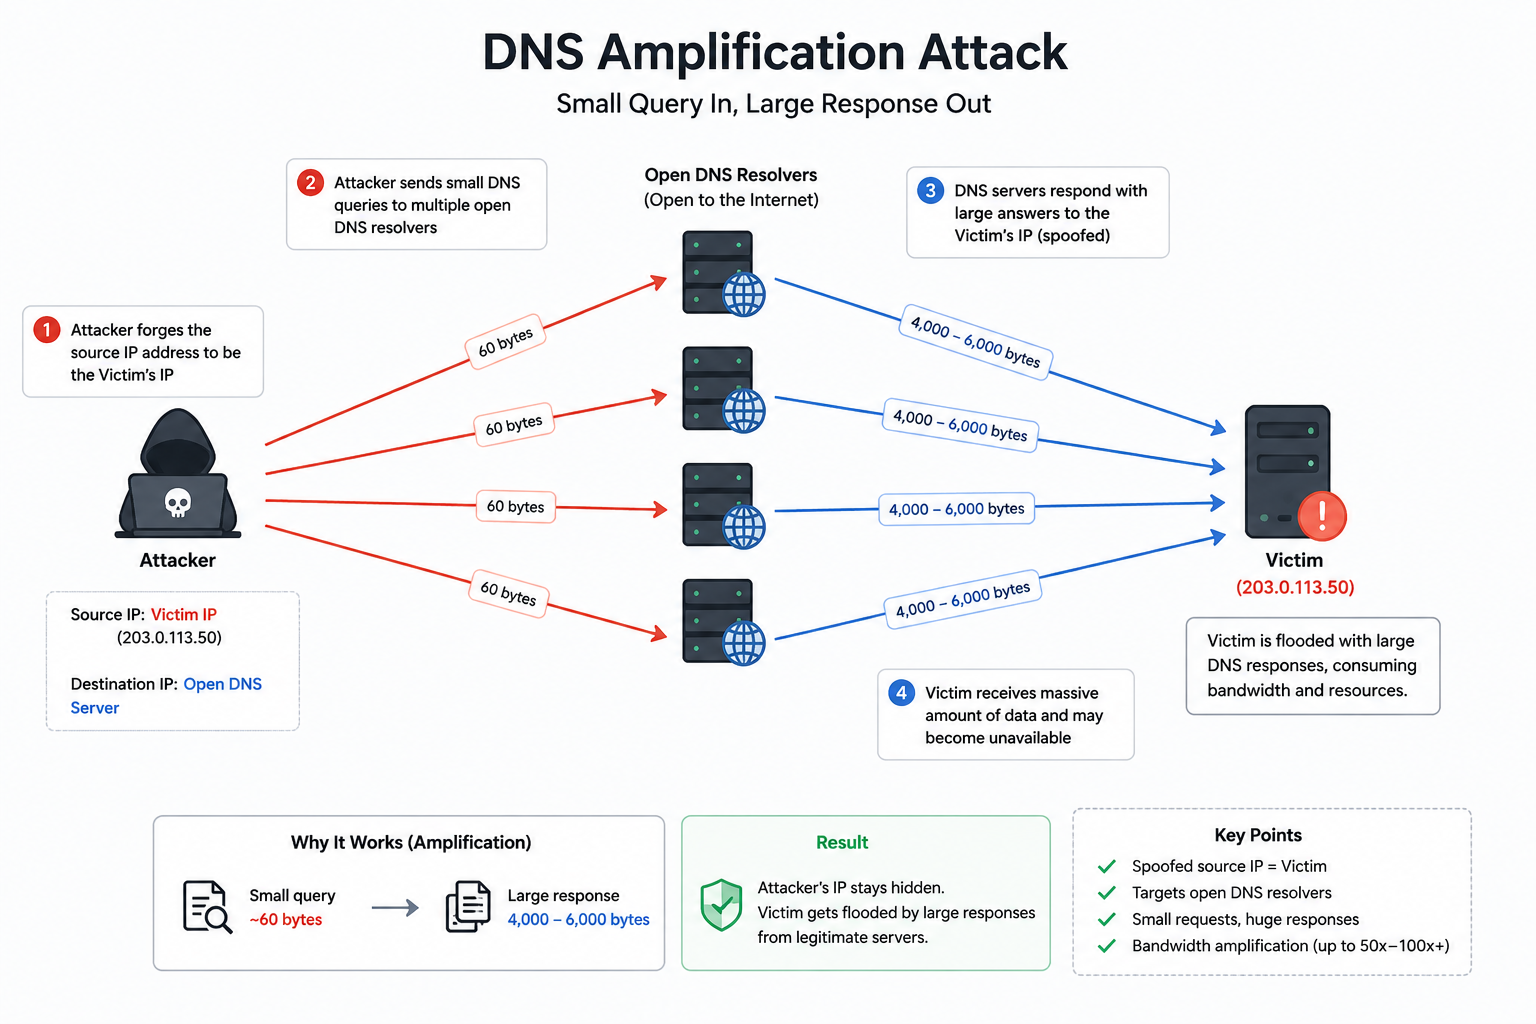
Every amplification attack follows the same recipe. The attacker sends a small request to a server that speaks a UDP protocol, but spoofs the source address so the reply goes to the victim instead. Because the response is many times larger than the request, the attacker turns a trickle into a torrent. The multiplier—the amplification factor—varies wildly by protocol:
| Protocol | Port | Typical amplification |
|---|---|---|
| Memcached | 11211 | up to ~50,000× |
| NTP (monlist) | 123 | up to ~550× |
| DNS | 53 | ~28–54× |
| SSDP | 1900 | ~30× |
| LDAP / CLDAP | 389 | ~50× |
| SNMP | 161 | ~6× |
Memcached is the nightmare case: a few hundred bytes can become megabytes.
The flow-data fingerprint
Amplification traffic looks nothing like legitimate use, and that’s exactly what makes it detectable in sFlow:
- A flood of responses from a single service port (53, 123, 11211, 1900…) with no matching pattern of outbound requests.
- Lopsided packet-size distribution—large UDP payloads streaming toward one or few destinations.
- Volume that spikes far above baseline for that protocol on your network.
Because sFlow streams sampled headers in real time, you see this developing immediately—you don’t wait for a flow record to age out of a cache first.
Catch every amplification vector automatically
BackendSide sFlow Collector & Analyzer ships with dedicated detectors for the full amplification family—DNS, NTP, memcached, LDAP, SNMP, SSDP, and CharGen—each tuned to the traffic signature and amplification profile of that protocol. It watches your live sFlow feed for the tell-tale response floods and raises an alert with the source, destination, and severity, so you know not just that you’re under attack but which vector is being abused and where. Whether the traffic is aimed at you or your own servers are being conscripted as reflectors, you find out fast.
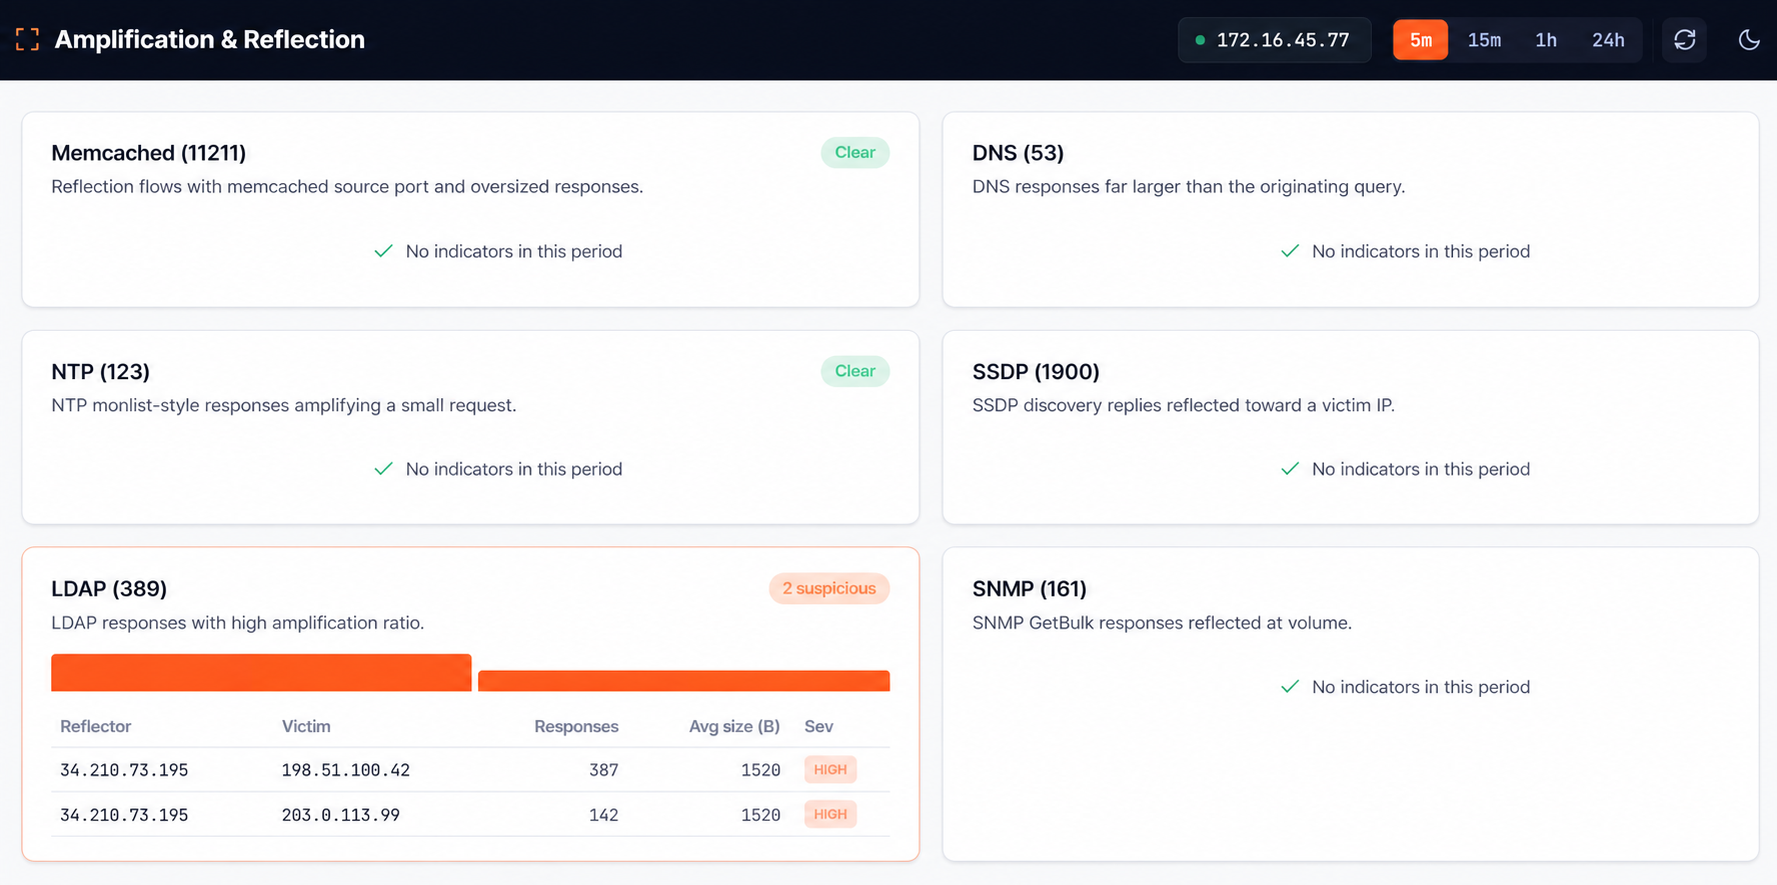
BackendSide sFlow Collector & Analyzer — Catch Every Amplification Vector Automatically
BackendSide sFlow Collector & Analyzer ships with dedicated detectors for the full amplification family — DNS, NTP, memcached, LDAP, SNMP, SSDP and CharGen — each tuned to the traffic signature and amplification profile of that protocol. It watches your live sFlow feed for the tell-tale response floods and raises an alert with the reflector, victim and severity, so you know not just that you are under attack but which vector is being abused and where.
The bottom line
Amplification attacks succeed because they’re fast, cheap, and often invisible until the pipe is already full. Flow telemetry gives you the one thing you need—early warning—and purpose-built detectors turn that warning into action. Don’t wait for your monitoring to catch up after the outage. Watch for the fingerprint and catch it at the source.
Leave a Reply