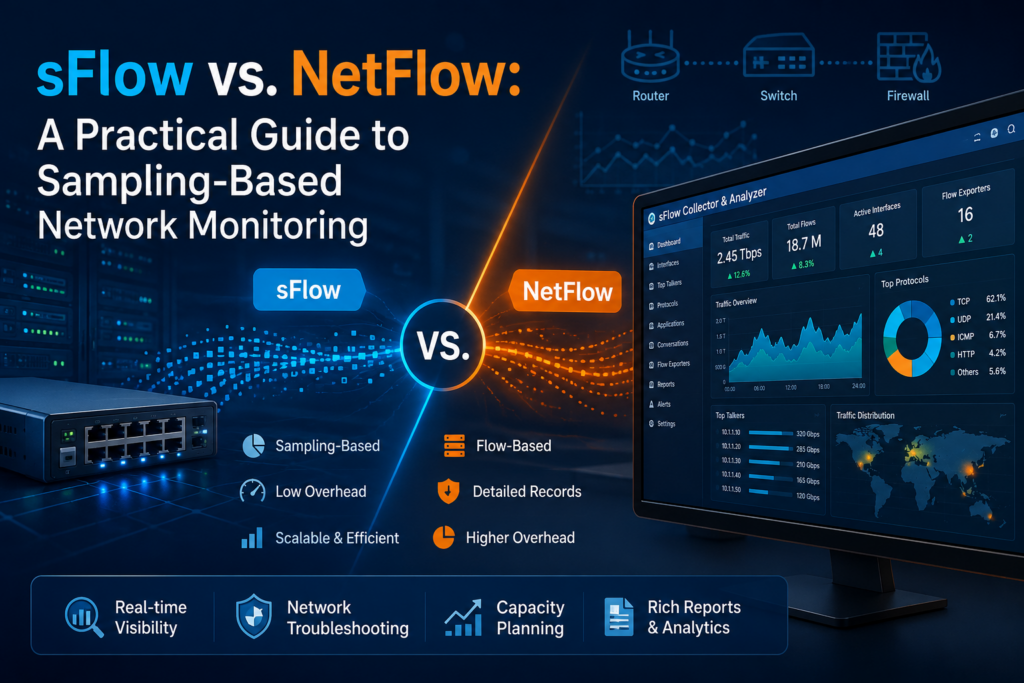
Every network team eventually asks the same question: what is actually flowing across my links right now? Two technologies dominate the answer—sFlow and NetFlow. They both give you visibility into traffic without tapping every packet, but they work in fundamentally different ways, and choosing the right one shapes everything from your hardware overhead to how fast you can spot an attack. This guide breaks down sFlow vs. NetFlow in plain terms, shows where each shines, and explains what it takes to turn that telemetry into something you can act on.
What is sFlow?
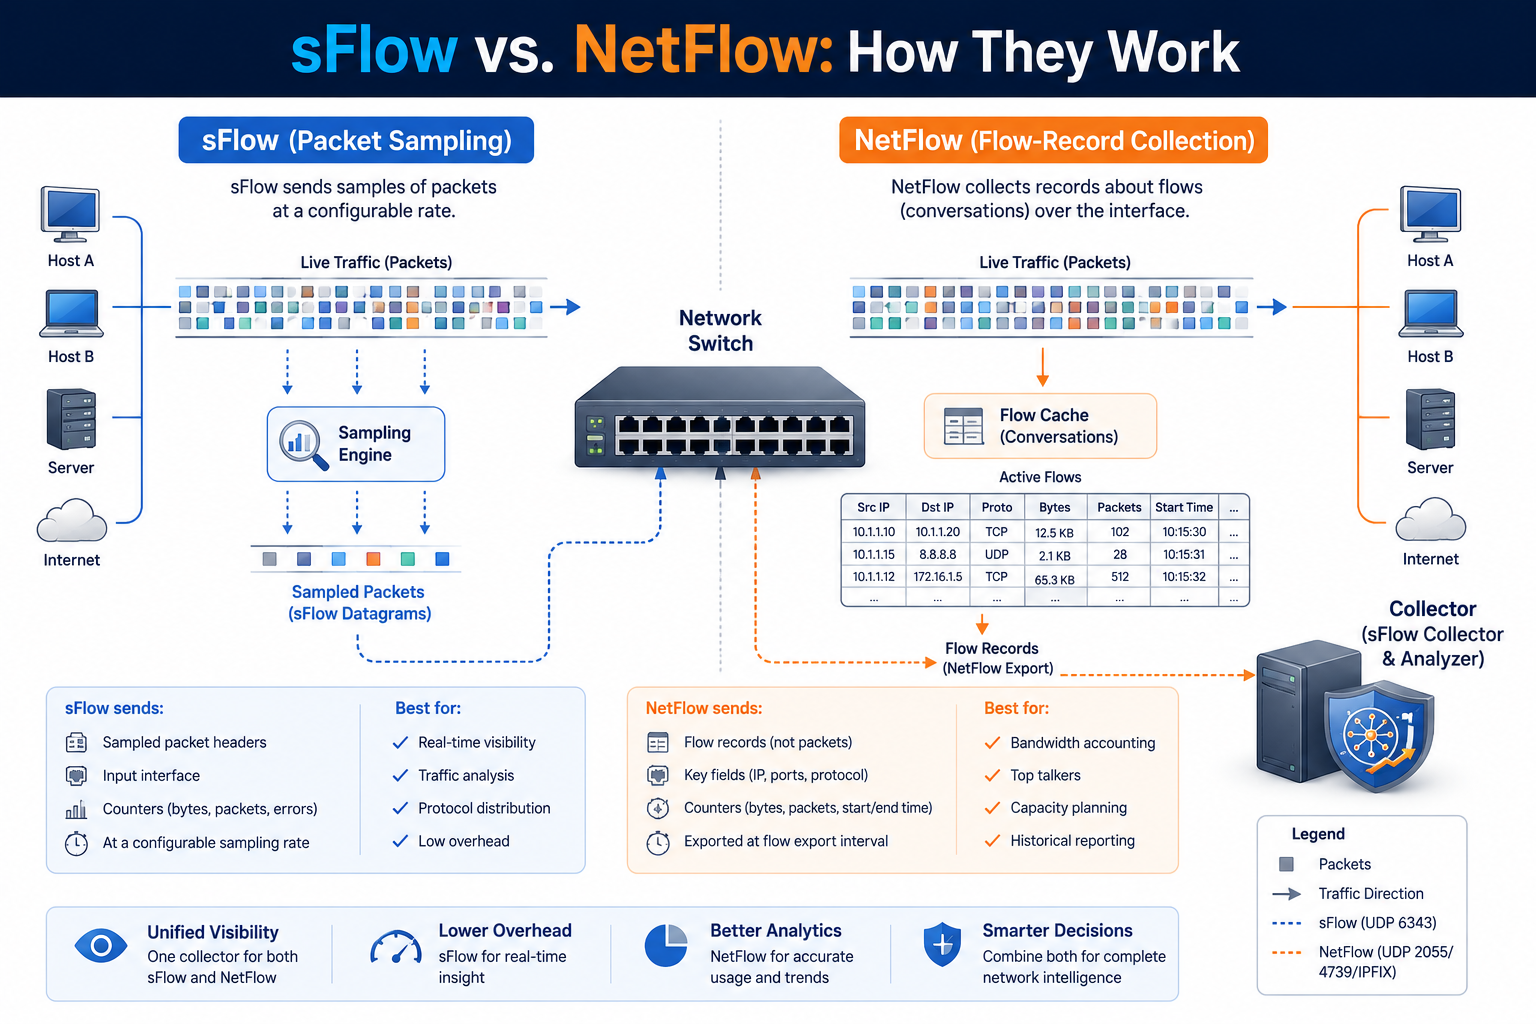
sFlow (“sampled flow”) is a streaming telemetry standard built for high-speed networks. Instead of tracking every packet, the switch samples 1 in N packets directly in the forwarding ASIC, grabs the first few bytes of each sampled packet—enough to read the headers—and streams them to a collector in near real time. It also periodically exports interface counters. Because the sampling happens in hardware, sFlow adds almost no load to the switch CPU and scales cleanly to 10G, 40G, and 100G links.
The key ideas: packet sampling, header export, real-time streaming, hardware-accelerated, multi-vendor. sFlow is a single open standard supported across a huge range of switch vendors.
What is NetFlow?
NetFlow, originally from Cisco, takes a different approach. The device maintains a flow cache: as packets pass, it groups them into flows (by source/destination IP, ports, protocol) and accumulates byte and packet counts. When a flow expires or the cache flushes, the device exports a summarized flow record. IPFIX is the IETF-standardized successor to NetFlow that most modern gear speaks.
The key ideas: flow aggregation, cached records, per-flow accounting. NetFlow gives you a complete accounting of flows the device saw, at the cost of maintaining that flow cache—which consumes memory and CPU, and can struggle at very high line rates.
sFlow vs. NetFlow at a glance
| Dimension | sFlow | NetFlow / IPFIX |
|---|---|---|
| Method | Statistical packet sampling | Flow-cache aggregation |
| Switch overhead | Very low (done in ASIC) | Higher (cache in CPU/memory) |
| Real-time | Immediate streaming | Delayed until flow export |
| Scales to 100G | Excellent | Varies by platform |
| Vendor support | Broad, single standard | Broad via IPFIX |
| Layer 2 visibility | Yes (raw headers) | Typically L3/L4 |
| Best for | Real-time visibility, DDoS & anomaly detection, high-speed links | Per-flow accounting, billing, exact byte counts |
When sFlow wins
Reach for sFlow when you need real-time visibility with minimal switch overhead, especially on fast or mixed-vendor networks:
- High-speed links. Sampling in hardware means 100G doesn’t melt your switch CPU.
- Security and DDoS detection. Because sFlow streams immediately, you can catch a flood or scan as it starts rather than minutes later when a flow record finally exports.
- Multi-vendor estates. One standard across Cisco, Juniper, Arista, HPE/Aruba, MikroTik and more—no per-vendor flow dialect to wrangle.
- Layer 2 insight. Raw header samples expose MAC addresses, VLANs, and ARP behavior that flow records usually drop.
When NetFlow makes sense
NetFlow’s per-flow accounting is the right call when you need an exact record of every flow—usage-based billing, chargeback, or compliance reporting where a sampled estimate isn’t good enough. If your priority is precise byte counts per customer rather than fast, broad visibility, flow records earn their keep.
The catch: telemetry is not insight
Here’s what both camps have in common—the protocol only gets the data off the switch. A raw sFlow feed is a firehose of sampled headers. On its own it tells you nothing. You need a collector and analyzer to decode the samples, scale them back up statistically, store them efficiently, chart them, and—critically—detect the attacks and anomalies hiding in them. That’s the piece that turns “we have sFlow enabled” into “we know exactly what’s happening on our network.”
Turn sFlow into answers
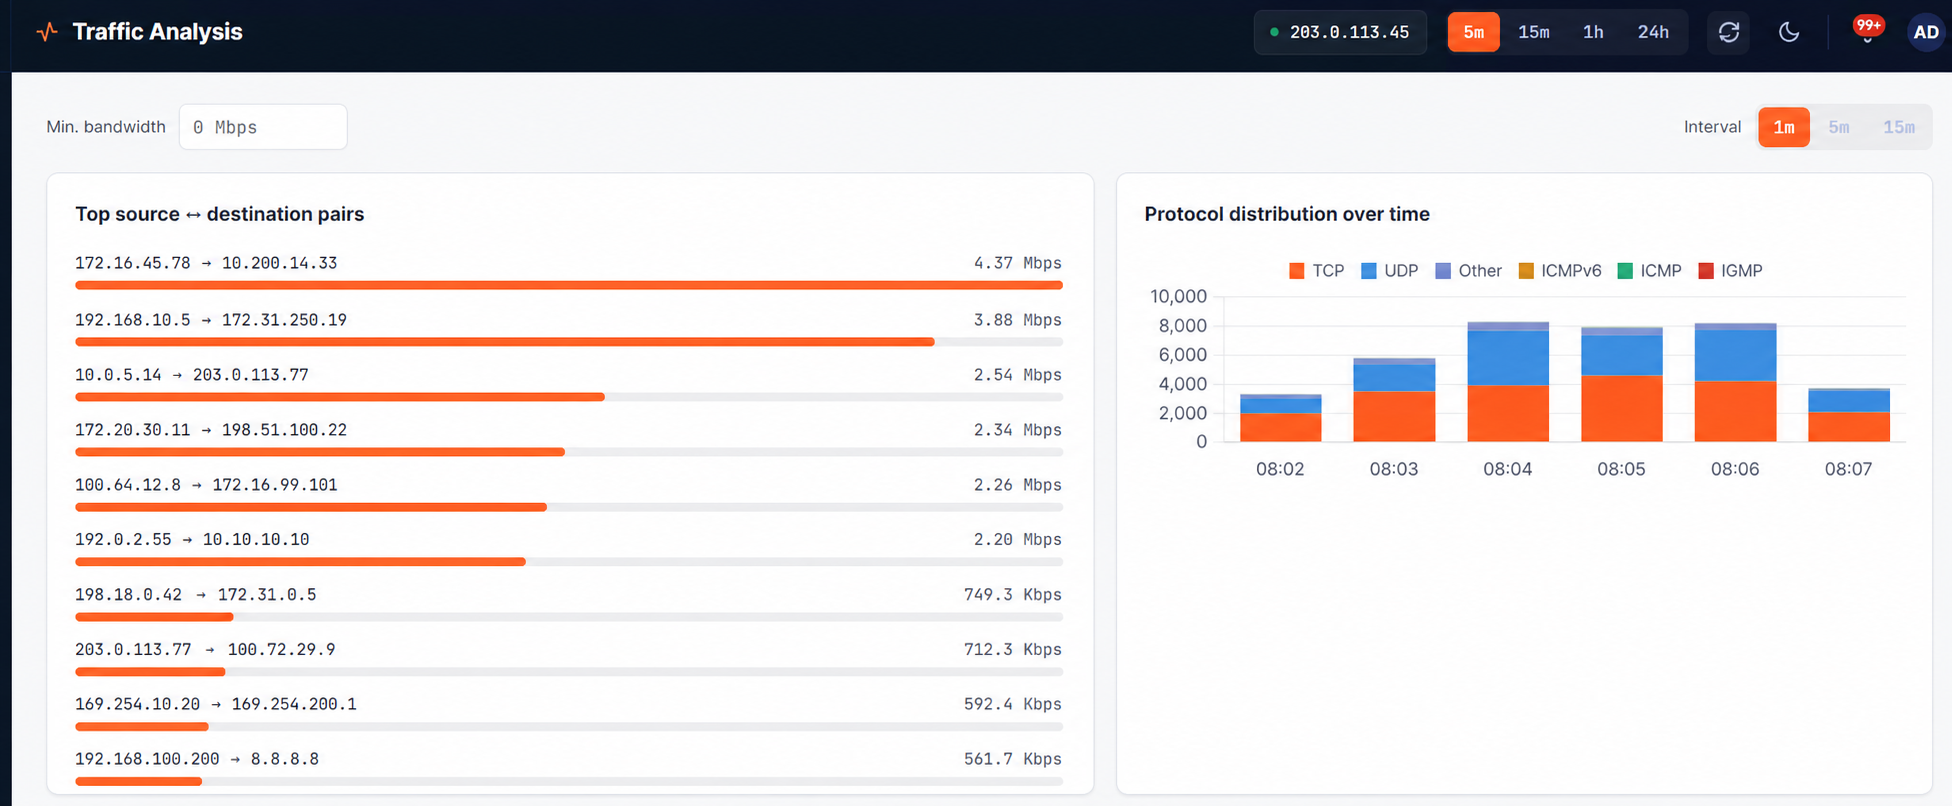
Point your switches and routers at a self-hosted collector and you immediately get more than a firehose of headers — you get an answer to “what is happening on my network right now?”:
- A live dashboard—bandwidth over time, top talkers, protocol distribution, per-VLAN and per-interface breakdowns.
- Built-in threat detection for port scans, SYN/UDP/ICMP floods, reflection/amplification attacks, ARP spoofing, and more.
- Adaptive baselines that learn what your network normally looks like and flag genuine deviations—no fragile static thresholds.
- Alerts that group repeating conditions into single, countable episodes instead of drowning you in duplicates.
BackendSide sFlow Collector & Analyzer — Turn a Raw sFlow Feed into Real-Time Network Visibility
BackendSide sFlow Collector & Analyzer is a self-hosted Windows application that ingests sFlow v5 from your switches and routers and turns it into a live, security-aware view of your network — real-time bandwidth, top talkers, protocol and per-VLAN breakdowns, plus built-in detection for port scans, SYN/UDP/ICMP floods, reflection/amplification attacks and ARP spoofing. No cloud, no per-flow licensing; every byte of data stays on your own machine.
The bottom line
sFlow vs. NetFlow isn’t about which is “better”—it’s about fit. If you want low-overhead, real-time, multi-vendor visibility and the ability to catch attacks the moment they start, sFlow is purpose-built for the job. Pair it with a capable collector and analyzer, and a technology that’s often left sitting unused in switch configs becomes one of the sharpest tools you have for understanding and defending your network.
Leave a Reply