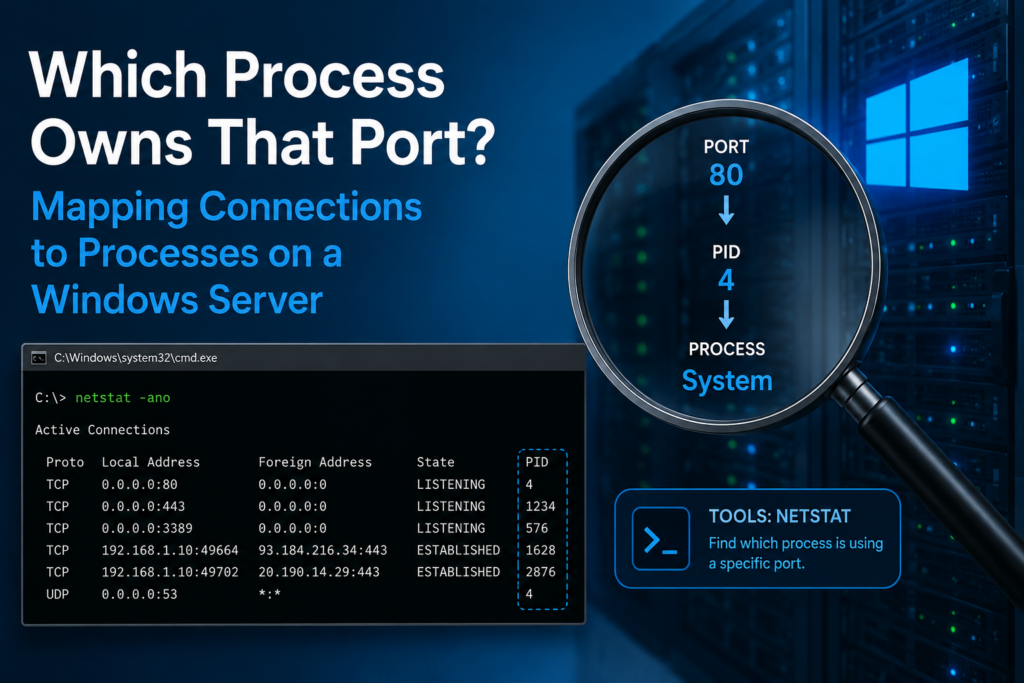
You run a quick scan and there it is: something is listening on port 8443, or an outbound connection keeps reaching a remote address you do not recognise. The port is easy to see. The hard question is always the same one — which process opened it? On Windows, every socket is owned by a process, and every process has a PID. Mapping a connection back to that PID, and then to a real executable on disk, is the core skill behind server monitoring, incident response and network debugging. This guide walks through every reliable way to do it.
The one number that ties it all together: the PID
A TCP or UDP endpoint on Windows is never anonymous. The kernel records the owning process ID (PID) for every connection and every listening socket. So the job is really two lookups:
- Port → PID — find which process ID owns the port or connection.
- PID → process — turn that number into a name and, ideally, a full path on disk so you know exactly what is running.
Do both and the mystery is solved. Let us do it manually first, so you understand what is happening, and then with a tool that collapses both steps into one live view.
Step 1 — Map the port to a PID with netstat
The classic tool is netstat. The flags that matter are -a (all connections and listening ports), -n (numeric — do not resolve names, which is much faster), and crucially -o (show the owning PID). Open an Administrator command prompt or PowerShell and run:
netstat -anoEvery row ends with a PID in the last column. A typical listening line looks like this:
  Proto  Local Address        Foreign Address      State        PID
  TCP    0.0.0.0:8443         0.0.0.0:0            LISTENING    5240
  TCP    10.0.0.12:52210      93.184.216.34:443    ESTABLISHED  7864
Now narrow it to the port you care about. On Windows, findstr is the filter of choice:
netstat -ano | findstr :8443
netstat -ano | findstr LISTENING
netstat -ano | findstr ESTABLISHED
The first line shows only rows touching port 8443; the others let you see just the listeners, or just the live established sessions. In the example above, port 8443 is owned by PID 5240. That is half the puzzle.
Step 2 — Turn the PID into a process name with tasklist
A bare number is not much use, so map it to a process. tasklist with a PID filter does exactly that:
tasklist /FI "PID eq 5240"Image Name PID Session Name Session# Mem Usage
=================== ==== =============== ========== ============
java.exe 5240 Services 0 412,880 KIf the PID turns out to be a svchost.exe — the shared host for Windows services — the name alone will not tell you which service is responsible. Add /svc to expand it:
tasklist /svc /FI "PID eq 5240"That lists every service hosted inside the PID, so you can tell whether it is the DNS Client, the Web Deploy agent, or something you did not expect.
The one-shot shortcut: netstat -anob
You can skip the two-step dance and ask netstat to print the owning executable directly with the -b flag:
netstat -anobThis shows the process name (and sometimes the component that requested the connection) under each row. It is handy, but it comes with two real costs: it requires Administrator rights, and it is noticeably slow — enumerating the executable for every socket can take many seconds on a busy server, and the output is verbose and awkward to scan. It is a good spot-check, not something you want to run in a tight loop.
The PowerShell way — and why it is nicer
On any modern Windows Server, PowerShell gives you the same mapping as structured objects you can filter and sort. Get-NetTCPConnection already includes the OwningProcess (the PID), so you can go straight from a port to the process in a single pipeline:
# Which process is listening on port 8443?
Get-Process -Id (Get-NetTCPConnection -LocalPort 8443 -State Listen).OwningProcess
That prints the process name, and because it is a real process object you also get the path via .Path. To see the connection and its owner side by side, join the two yourself:
Get-NetTCPConnection -State Listen |
  Select-Object LocalAddress, LocalPort, State, OwningProcess,
    @{Name='Process'; Expression={ (Get-Process -Id $_.OwningProcess).Name }},
    @{Name='Path';    Expression={ (Get-Process -Id $_.OwningProcess).Path }} |
  Sort-Object LocalPort | Format-Table -AutoSize
UDP listeners work the same way through Get-NetUDPEndpoint. This is far more pleasant than parsing netstat text, and it is scriptable — but you are still hand-writing calculated properties every time, and each snapshot is frozen the instant it runs.
Where the manual approach starts to hurt
These commands all work, and every Windows admin should know them. But on a live server the friction adds up:
- It is a static snapshot.
netstatandGet-NetTCPConnectioncapture one instant. A connection that flickers open for half a second between two runs is simply invisible. - Port → PID → name → path is three joins. You are constantly copying a PID from one command into the filter of the next, and the fast options rarely give you the full executable path — the single most useful field for deciding whether something is legitimate.
-bis slow and needs admin. The one command that shows the executable is the one you least want to run repeatedly.- Acting on a finding is a separate job. Once you have identified a rogue connection, blocking it means switching to
netsh advfirewallor the Firewall MMC and re-typing the IP, port and protocol by hand.
For a one-off “who has port 8443?” the command line is perfect. For actually watching a server — catching short-lived connections, seeing the full path at a glance, and blocking something the moment you spot it — you want a live view.
Process & Port Analyzer — See the Owning Process for Every Connection
Process & Port Analyzer is a free Windows utility that lists every active TCP/UDP connection and listening port alongside its PID, process name and full executable path — live, refreshing in real time, with no manual PID-to-name lookup. Right-click any suspicious connection to block it with a one-click firewall rule. Native Windows APIs only, no Npcap or third-party drivers.
The faster way: a live process-to-port map
Process & Port Analyzer does both lookups for you, continuously. Instead of running three commands and joining their output in your head, you open one window and read the answer straight off the row.
Every connection already carries its owner
The Active TCP/UDP Connections view lists each connection with its protocol, local IP and port, remote IP and port, connection state (ESTABLISHED, TIME_WAIT, and so on), and the owning PID, process name and full executable path — all on the same line, refreshing in real time. There is no second lookup: the port and the process that opened it are already together.
Listening ports, sorted and named
The Listening Ports view shows every TCP and UDP socket in a listening state with its owning PID, process name and full file path, so “what is accepting inbound connections on this box?” is answered the moment the window opens. Click the port column to sort — numeric columns sort as integers, not text, so port 80 does not end up next to port 8000.
From “what is this?” to “block it” in one right-click
When a connection looks wrong, you do not need to leave the app. Right-click it and choose Block this connection: the built-in Windows Firewall rule creator opens pre-filled with that connection’s IP, port and protocol, and a block rule is in place in seconds. The same manual investigation that took three commands and a trip to the firewall console becomes point, read, right-click.
Drill into a process
Suspicious PID? The Running Processes view lists every process with its PID, name and full path, and a double-click opens a module view showing every DLL and file that process has loaded — useful when a legitimate-looking host process is doing something it should not.
Manual commands vs. Process & Port Analyzer
| Task | Manual (netstat / PowerShell) | Process & Port Analyzer |
|---|---|---|
| Port → PID | netstat -ano | findstr :PORT |
✅ Shown on every row |
| PID → process name | Second command: tasklist /FI |
✅ Same row, no lookup |
| Full executable path | ⚠️ -b (slow, admin) or PowerShell .Path |
✅ Always shown |
| Live / continuous view | ❌ Static snapshot per run | ✅ Real-time refresh |
| Catch short-lived connections | ❌ Easy to miss between runs | ✅ Appear as they happen |
| Block a bad connection | netsh advfirewall / MMC, re-typed by hand |
✅ Right-click → pre-filled block rule |
| Cost | Built in | Free on the Microsoft Store |
A practical workflow
- Spot the port. Something is listening on 8443, or an outbound session keeps reappearing.
- Find the owner. Quick check from the shell:
netstat -ano | findstr :8443, thentasklist /FI "PID eq <pid>". Or open Process & Port Analyzer and read the PID, name and path off the row directly. - Judge it. Is the full executable path where you would expect it — a service in
C:Program Files..., or something loading out of a temp directory? The path is what tells you. - Act. If it is legitimate, you are done. If it is not, right-click the connection and block it, then investigate the process and its loaded modules.
Key takeaways
- Every Windows connection and listening port is owned by a PID — mapping a port to a process is really two lookups: port → PID and PID → process.
netstat -anogives you the PID;netstat -ano | findstr :PORTnarrows it to a port;tasklist /FI "PID eq N"(add/svcforsvchost) names it.netstat -anobshows the executable in one shot but needs admin and is slow; PowerShell’sGet-NetTCPConnection+Get-Processis cleaner and scriptable.- The manual commands are perfect for a one-off, but they are static snapshots that miss short-lived connections and rarely show the full path in one step.
- Process & Port Analyzer shows the PID, process name and full path on every connection and listening port in a live view — and lets you block a suspicious connection with a single right-click. It is free on the Microsoft Store.
Learn the commands — they are the foundation, and they are always there when you SSH into a box with nothing installed. But for the everyday job of watching what your Windows server is really talking to, a live process-to-port map turns a three-command investigation into a glance.
Process & Port Analyzer — See the Owning Process for Every Connection
Process & Port Analyzer is a free Windows utility that lists every active TCP/UDP connection and listening port alongside its PID, process name and full executable path — live, refreshing in real time, with no manual PID-to-name lookup. Right-click any suspicious connection to block it with a one-click firewall rule. Native Windows APIs only, no Npcap or third-party drivers.
lol mapping every TCP and UDP connection back to the owning process is sooo useful, and the built-in packet capture made troubleshooting feel way easier bbe!! are u planning to cover Linux tools with the same workflow too??
Thanks, for linux BackendSideMon for linux have this feature. you can expore it on our website, and its free to use