Event Viewer is the first place to look when something goes wrong on Windows — and one of the most underused tools in the box. Most people open it, feel overwhelmed by the noise, and close it again. With a little structure it becomes a precise diagnostic instrument.
The logs you need to know
- System — the operating system and drivers: services, hardware, boot and shutdown.
- Application — events from installed programs and their crashes.
- Security — audit events: logons, privilege use, object access.
- Setup — installation and servicing of Windows components.
- Forwarded Events — events collected from other machines.
Severity levels
Every event carries a level: Information, Warning, Error or Critical (plus Audit Success/Audit Failure in the Security log). When triaging, filter to Error and Critical first — that removes most of the noise instantly.
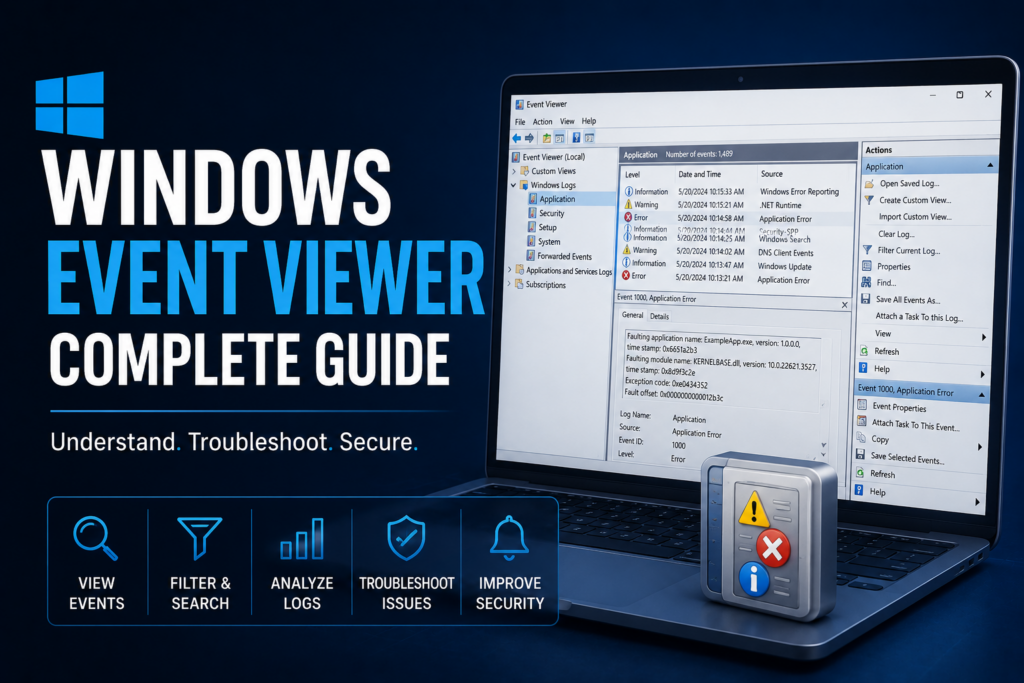
Anatomy of an event
Each entry tells you the Source (which component logged it), the Event ID (a number identifying the specific event type), the Level, the user and timestamp, and a details pane (readable on the General tab, or as raw XML on the Details tab). The Event ID is the key you will search the web and your own notes for.
Cut through the noise with filters and custom views
Right-click a log and choose Filter Current Log to narrow by level, Event ID, time range or source. When you find a filter you use often, save it as a Custom View so it is one click away next time — for example, “all Errors and Criticals in the last 24 hours across System and Application.”
Useful Event IDs to recognise
| Event ID | Meaning |
|---|---|
| 4624 / 4625 | Successful / failed logon (Security) |
| 6005 / 6006 | Event log service started / stopped (proxy for boot / clean shutdown) |
| 41 | Kernel-Power: system rebooted without a clean shutdown |
| 7000 / 7001 | A service failed to start / depends on a service that failed |
| 7045 | A new service was installed (useful for spotting unwanted software) |
| 1000 / 1001 | Application crash / Windows Error Reporting entry |
Process & Port Analyzer — See What Windows Is Doing
When an event points to a misbehaving process or a suspicious connection, Process & Port Analyzer shows you the whole picture: running processes, active TCP/UDP connections, listening ports, a built-in packet sniffer, and your firewall rules — the perfect companion to Event Viewer for tracking an issue to its source.
Filter at scale from the command line
For repeatable queries and scripting, PowerShell’s Get-WinEvent is far more powerful than the GUI:
# the 20 most recent System errors
Get-WinEvent -FilterHashtable @{ LogName='System'; Level=2 } -MaxEvents 20

# all failed logons in the last day
Get-WinEvent -FilterHashtable @{ LogName='Security'; Id=4625; StartTime=(Get-Date).AddDays(-1) }
You can also export any log to an .evtx file (right-click → Save All Events As, or wevtutil epl) to archive it or analyse it on another machine.
DeepDig — Your Event Logs, Explained in Plain English
Everything in this guide, done for you. DeepDig reads these same Windows event logs and turns them into plain-English incidents — correlating related events, scoring severity, and adding recommended fixes and a MITRE ATT&CK mapping. It also runs a read-only registry security audit and can watch live. Scan this PC or open an exported .evtx file — 100% local, no telemetry.
Make events work for you
Right-click an event and choose Attach Task To This Event to have Windows automatically run a program, or send a notification, whenever that event recurs. It is a simple way to turn a passive log into an active alert.
Stop waiting for the log
Event Viewer is reactive — you go looking after something already happened. For the things that matter most, it pays to watch continuously and be told the moment a threshold is crossed.
BackendSideMon — Real-Time Server Monitoring
Running commands by hand tells you how a server is doing right now; BackendSideMon tells you around the clock. It tracks TCP/UDP/ICMP stats, processes and connections through a clean web dashboard, and runs as a service on both Windows and Linux — so problems surface before your users report them.
Key takeaways
- Know the core logs: System, Application, Security.
- Filter to Error and Critical first, then save useful filters as Custom Views.
- Learn to read Event IDs — they are the fastest path to a root cause.
- Use Get-WinEvent for scripting and large-scale filtering.
- Attach tasks to important events to turn logs into alerts.
Once you know where to look, recurring Windows problems become obvious — and far quicker to fix.
Leave a Reply